QUAL Vs. JQUA For Quality-Factor ETF Title (NYSEARCA:JQUA)
gesrey/iStock via Getty Images
(This article was co-produced with Hoya Capital Real Estate)
Introduction
Factor-based ETFs came into existence as ETF sponsors looked for ways to bring in more assets (read fees) by trying to come up with strategies that would beat the plain-vanilla ETFs based on popular indices like the S&P 500, Russell 2000, or the NASDAQ. Investors can pick from dividend-focused (high or growth), momentum, low volatility, ESG, and the one covered here: quality. But like the others, there really is not a universally accepted definition of what quality investing means. Each ETF manager has their own “black box” to analyze stocks and come up with the best mix.
Looking at quality-focused ETF with at least four years of history, I came up with one well known one, the iShares MSCI USA Quality Factor ETF (BATS:QUAL), and one lessor known but the top performer since it started in November of 2017: the JPMorgan U.S. Quality Factor ETF (NYSEARCA:JQUA). This article reviews both and does a comparison. Later, I will included two more popular quality-focused ETFs when reviewing performance data. Also included is a list of non-quality factor ETFs to consider.
Exploring the iShares MSCI USA Quality Factor ETF
Seeking Alpha describes this ETF as:
iShares MSCI USA Quality Factor ETF is managed by BlackRock Fund Advisors. QUAL invests based on the MSCI USA Sector Neutral Quality Index composed of U.S. large- and mid-capitalization stocks with quality characteristics as identified through certain fundamental metrics. QUAL may invest up to 10% of its assets in certain futures, options and swap contracts, cash and cash equivalents. The ETF started in 2013.
Source: seekingalpha.com QUAL
QUAL has amassed $13.7b in AUM, making in much larger than the JPM ETF. The TTM yield is 1.27%; fees comes to 15bps. The manager lists three reasons to own their quality-based ETF:
ishares.com QUAL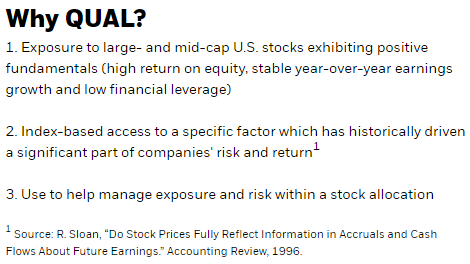
MSCI USA Sector Neutral Quality Index reviewed
MSCI describes their index as:
The MSCI USA Sector Neutral Quality Index captures large and mid-cap representation across the US equity markets. The index aims to capture the performance of securities that exhibit stronger quality characteristics relative to their peers within the same GICS® sector by identifying stocks with high quality scores based on three main fundamental variables: high Return-on-Equity (ROE), low leverage and low earnings variability.
Source: msci.com Indices
The Index Methodology PDF provides the rules used for constructing the Index, starting with the three variables used to generated a combined Z-score.
info.msci.com Index Methodology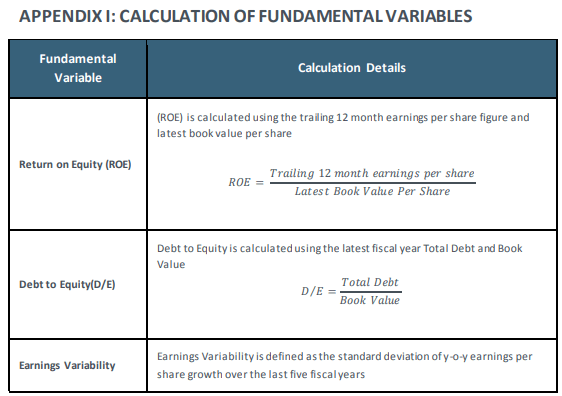
Other points mentioned included:
- Stocks must be included in the MSCI USA Index.
- The Quality Score is computed within each sector. The index methodology also targets to minimize active weights on sectors.
- At each rebalancing, all the securities eligible for inclusion in the MSCI Quality Indexes are weighted by the product of their market capitalization weight in the Parent Index and the Quality Score.
- The MSCI Quality Indexes are rebalanced on a semi-annual basis, usually as of the close of the last business day of May and November.
msci.com indices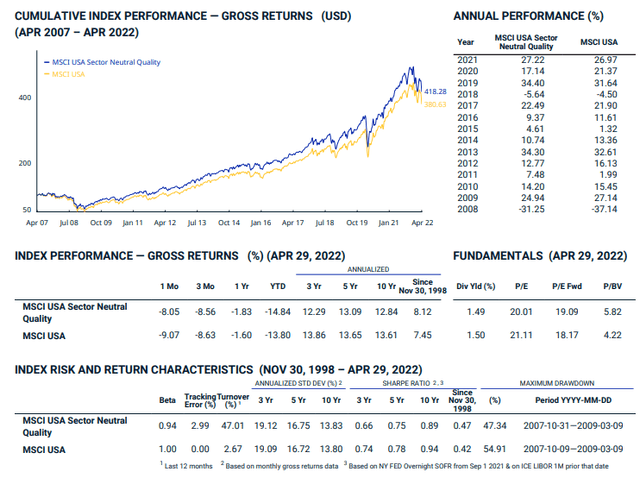
While since 1998, the Quality Index has a better CAGR, that has hasn’t been the case most of the time periods since until recently.
QUAL Holdings review
iShares.com QUAL
With only 125 securities, QUAL is more concentrated than many index-based ETFs and this is reflected in the fact the Top 10 positions comprise 32% of the assets.
iShares.com; compiled by Author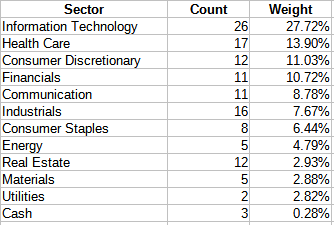
I was surprised to see QUAL’s technology weight being higher than some S&P 500 ETFs, but then Quality and Value/Growth are not the same measuring rods.
iShares.com; compiled by Author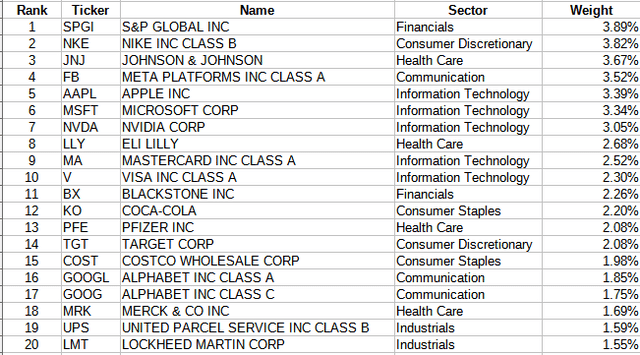
These stocks represent 51% of the portfolio. Most sectors have at least one stock in the Top 20. QUAL currently holds a small position in the June S&P Emini futures.
QUAL Distribution review
seekingalpha.com QUAL DVDs
With a yield below 1.5%, investors would not be owning QUAL for its income generation. The low yield helps explain the C- rating that was awarded by Seeking Alpha.
seekingalpha.com DVD rating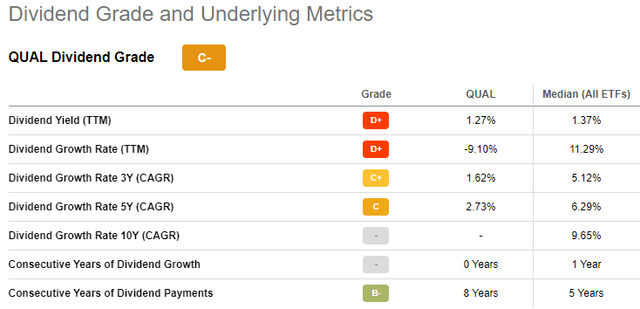
That said, overall, QUAL is graded much higher.
seekingalpha.com QUAL grades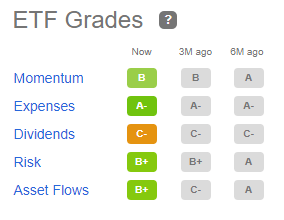
Exploring the JPMorgan U.S. Quality Factor ETF
Seeking Alpha describes this ETF as:
JPMorgan U.S. Quality Factor ETF is managed by J.P. Morgan Investment Management. It invests in stocks of companies operating across communication services, telecommunication services, consumer discretionary, consumer services, energy, financials, health care, industrials, information technology, materials, utilities sectors. It invests in growth and value stocks of companies across diversified market capitalization. It seeks to track the performance of the JP Morgan US Quality Factor Index. JQUA started in late 2017.
Source: seekingalpha.com JQUA
JQUA has $430m in assets and carries a small 12bps fee expense. The yield is also small at 1.4%. The manager lists these reasons to own their quality-based ETF:
am.jpmorgan.com JQUA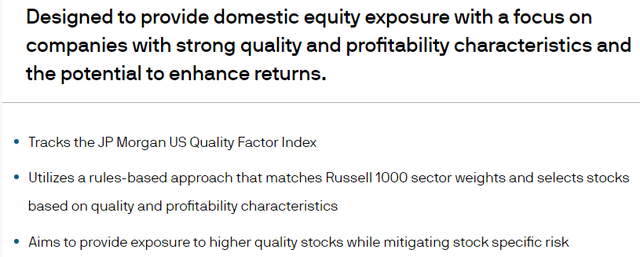
JP Morgan US Quality Factor Index reviewed
A good start in understanding any ETF that invests, not just benchmarks against, an index is with that index.
The JP Morgan US Quality Factor Index is comprised of US securities selected from the Russell 1000® Index and uses a rules-based risk allocation and factor selection process developed by J.P. Morgan Asset Management. The index is designed to reflect a sub-set of US securities selected for their factor characteristics. The index selects constituents based on their quality as measured by diversified definitions of their profitability, solvency, and earnings quality without undue concentration in individual securities.
Source: ftserussell.com Indices
The JPM indices are a joint venture with FTSE Russell. The index holds 261 stocks and is reviewed at the end of each quarter. This Index uses ten factors to determine what “quality” is.
research.ftserussell.com Methodology PDF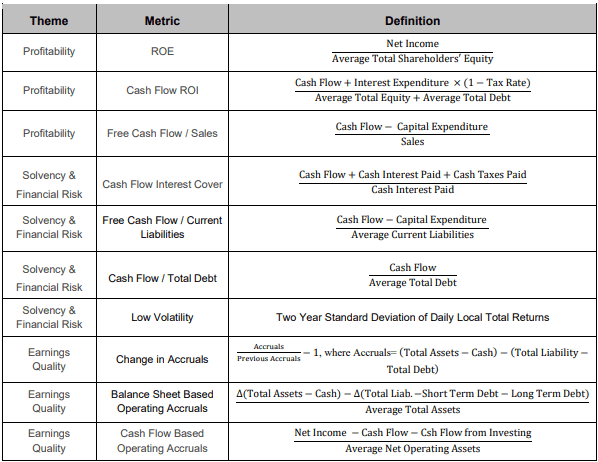
research.ftserussell.com Index PDF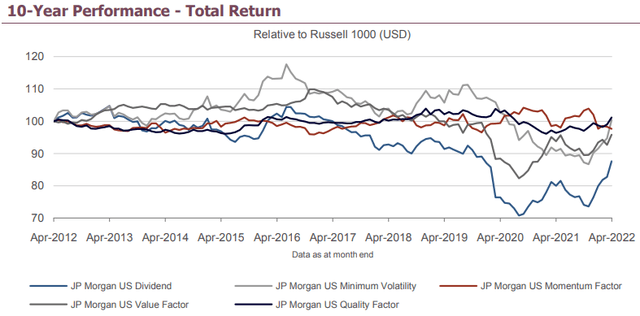
Over the past ten year, the Quality index has been more stable than the other JPM factor indices. Over the last five years, only the Min-Volatility index had lower volatility. Another comparison is against the whole Russell 1000. A rising line means the Quality Index was outperforming the total Index.
research.ftserussell.com Index PDF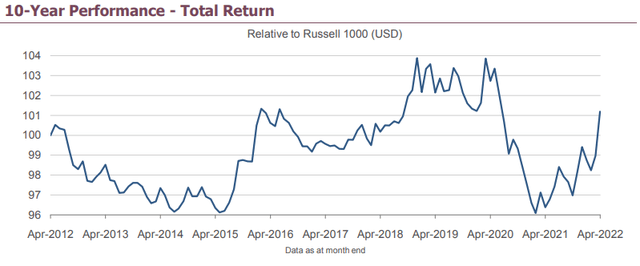
JQUA Holdings review
am.jpmorgan.com JQUA Factsheet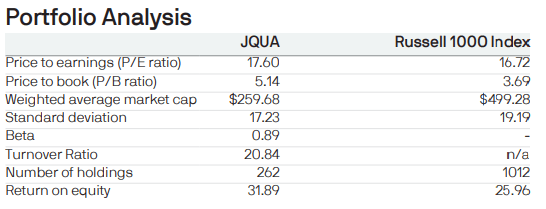
JQUA hold more than twice the number of stocks than what QUAL does. Both P/E and P/B ratios reflect a slightly more Value orientation than QUAL.
JPMorgan.com; compiled by Author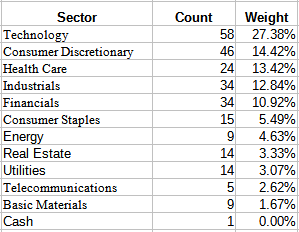
Again, Technology stocks are the top sector, with Consumer Discretionary and Health Care switching places.
JPMorgan.com; compiled by Author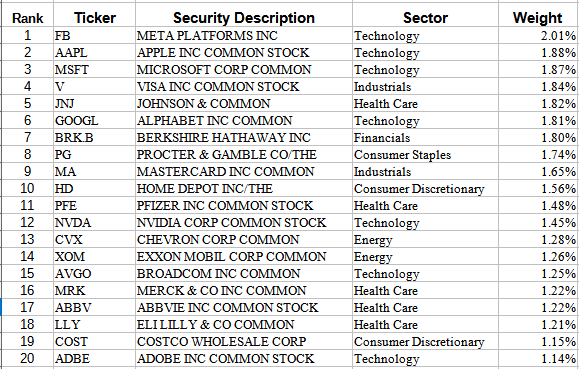
Almost reads like a “who’s who” of the S&P 500 index. The Top 10 account for 18% of the weight, with the Top 20 being 31%. As one would expect, JQUA is less concentrated at the top than QUAL. QUAL’s top holding only ranks 42nd here. JQUA also holds a small position in S&P 500 Emini June futures contracts.
JQUA Distribution review
seekingalpha.com JQUA DVDs
Like QUAL, JQUA is not for income seekers. Seeking Alpha grades
this ETF dividend history as a B+.
seekingalpha.com DVD rating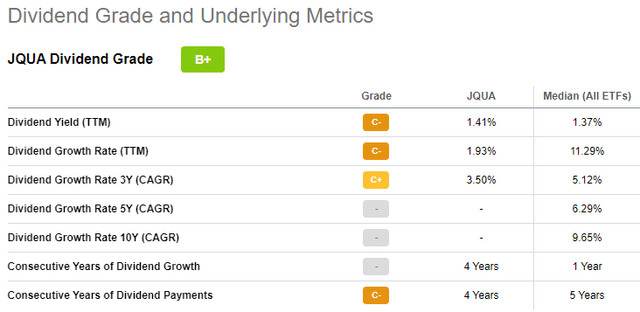
Overall, JQUA earned these grades.
seekingalpha.com JQUA grades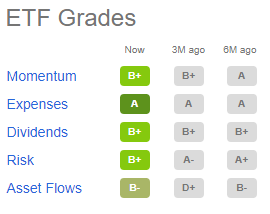
Comparing ETFs
ETFRC.com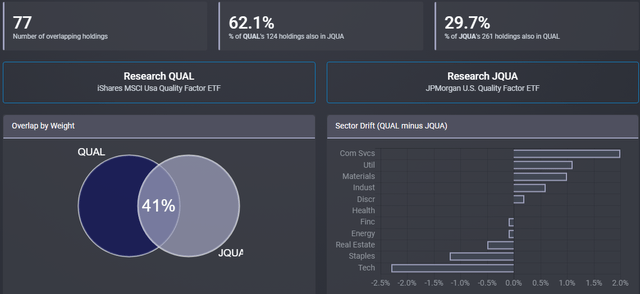
As I mentioned at the start of this article, Quality investing is determined by each manager. The above data shows how the asset selection and sector weights differ between QUAL and JQUA. While no sector weighting differs by greater than 2.5%, there are four with a 1% difference or more. Looking at individual positions, we see these Top differences from each side.
ETFRC.com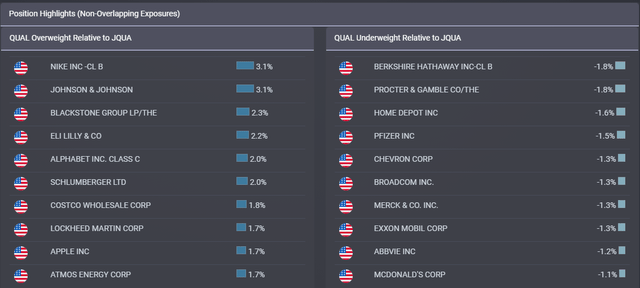
Such a comparison can help an investor decide which quality-factoring ETF they agree more with in how they define that term.
Performance review
Here I will add the widely followed Invesco S&P 500 Quality ETF (SPHQ) and a smaller one, the Fidelity Quality Factor ETF (FQAL).
PortfolioVisualizer.com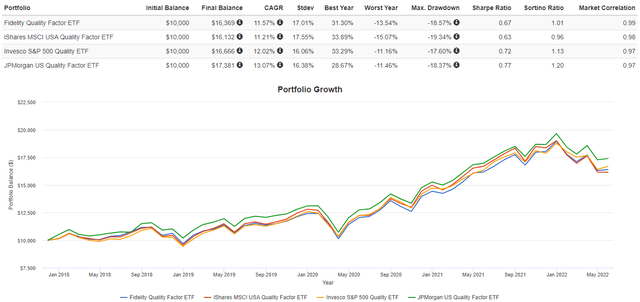
Since JQUA started in late 2017, it has the best CAGR and second best StdDev of this set of quality-only-focused ETFs, resulting in the highest Sharpe and Sortino risk ratio scores.
Of course the real test isn’t against other quality ETFs but against a fund it more likely would replace in an investor’s equity allocation, the SPDR S&P 500 ETF (SPY).
PortfolioVisualizer.com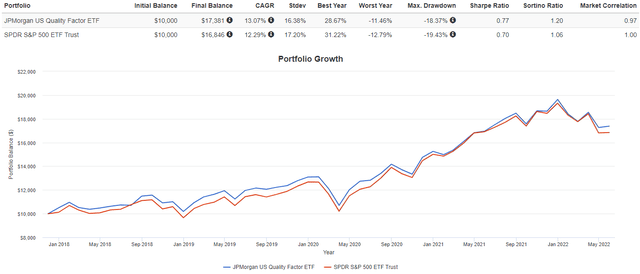
Investors would have done better owning JQUA over SPY since late 2017 thru May 2022. That also came with less risk as measured by StdDev.
Portfolio Strategy
In my view, when considering any factor-based fund, examining its sector allocation should be a top priority, as is understanding the selection criteria used. Both should be compared against the larger universe of stocks that would be owned if the factor rules were not applied. In this case, I think the S&P 500 index is the best comparison, for which SPY is a good proxy. I consider this important as sectors perform differently over the economic cycle, which is critical for short-term traders. Comparing JQUA versus SPY, we see JQUA overweight Technology and underweight Communication Services the most. For investors wanting stock diversification, 91% of QUAL is held by SPY, whereas only 70% of JQUA is. For that reason, I would consider replacing some of my Large-Cap allocation with JQUA, but not QUAL.
Final Thought
I am including this table to show both other Quality ETFs and a few other factor ETFs to show how their performances compare and a starting point for more research by those interested.
Hoya Capital Income Builder
